
Featured Galleries CLICK HERE to View the Video Presentation of the Opening of the "Holodomor Through the Eyes of Ukrainian Artists" Exhibition in Wash, D.C. Nov-Dec 2021
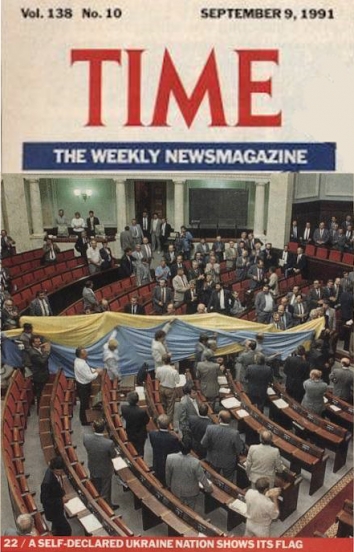
 USUBC COLLECTION OF OVER 160 UKRAINE HISTORIC NEWS PHOTOGRAPHS 1918-1997
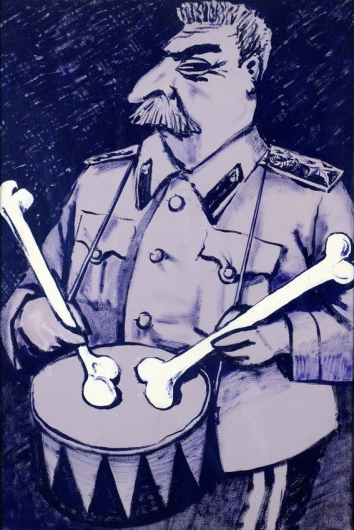
 "HOLODOMOR 1932-33: THROUGH THE EYES OF UKRAINIAN ARTISTS" - COLLECTION OF POSTERS AND PAINTINGS
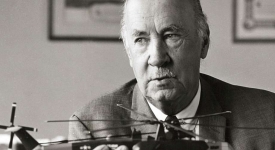
 USUBC COLLECTION OF HISTORIC PHOTOGRAPHS ABOUT LIFE AND CAREER OF IGOR SIKORSKY PHOTOGRAPHS - INVENTOR OF THE HELICOPTER
 Ten USUBC Historic Full Page Ads in the Kyiv Post


UKRAINE - MACROECONOMIC SITUATION – OCTOBER 2017
 ANALYTICAL REPORT: by Oleg Ustenko, Djulia Segura, Valentyn Povroznyuk, Edilberto L. Segura
SigmaBleyzer private equity investment management firm & The Bleyzer Foundation (TBF), Kyiv, Ukraine
LINK:Ukr_Monthly_Ec_Report_October 2017.pdf
Published by U.S.-Ukraine Business Council (USUBC),
Washington, D.C., Mon, Nov 27, 2017
WASHINGTON, D.C. - The "Ukraine Macroeconomic Situation – October 2017" analytical report is found below and as an attachment to this communication. The monthly macroeconomic situation report is prepared by the SigmaBleyzer multinational private equity firm, www.SigmaBleyzer.com, and The Bleyzer Foundation (TBF), www.BleyzerFoundation.org, Kyiv, Ukraine, who are members of the U.S.-Ukraine Business Council (USUBC), http://www.USUBC.org.
NOTE: The complete Ukraine - Macroeconomic Situation - report for October 2017 in PDF format, with a series of important, color charts and graphs, can be found by following the LINK: Ukr_Monthly_Ec_Report_October 2017.pdf
Executive Summary
- Russian-backed rebels have continued their frequent fire against Ukrainian forces, which responded in kind. All these attacks are recorded by the members of the OSCE monitoring mission in the region. A positive development for Ukraine has been the reactivation of talks about a UN peace-support mission that may be established in the temporary-occupied territories of Donbass.
- On the reform agenda, Ukraine is expected to submit legislation to establish anticorruption courts within the next few weeks. Along with the privatization law, which has passed first hearing in Verhovna Rada in November, these measures will significantly improve the country’s business climate over time.
- In the third quarter of 2017, Ukraine’s GDP grew by 2.1% year-over-year, a rate higher than the 1.7% yoy previously anticipated. This growth was fueled by domestic demand (investment activity and household consumption), stimulated by a 19% yoy increase in real wages in January-September 2017. Ukraine’s GDP is expected to growth by 2.2% in 2017, increasing to 3.5% in 2018.
- A monthly increase in fiscal expenditures and a monthly decline in revenues led to a fiscal deficit of UAH 23.5 billion in the state budget in September. Taking into account the deficit of local budgets of UAH 3.5 billion, the cumulative nine-month fiscal budget balance remained positive but significantly declined to UAH 41.7 billion (2.1% of GDP).
- Consumer inflation remained virtually unchanged in September. The all-items index remained at 16.4% yoy. The core inflation also remained almost flat at 7.7% yoy.
- In the banking sector, deposits continued to expand in September. National currency deposits expanded by 12.4%, a growth rate similar to August’s rate. Similarly, foreign currency deposits denominated in USD expanded by 6.1% yoy. On the banking assets side, national currency bank lending continued to grow. In September, household loans expanded by 19.6% yoy, whereas corporate loans increased by 20.0% yoy. The growth of the monetary supply in September was 1.8% yoy.
- During October, the UAH/USD exchange rate saw several reversals of trends, due to fluctuations in repatriation of dividends and VAT reimbursements. As a result, the UAH/USD exchange rate depreciated by 1.35% during the month reaching 26.87 UAH per USD.
- In September 2017, Ukraine’s current account deficit of the balance of payments increased by 5.8% yoy to USD 998 million. This deficit was due to a large deficit in trade in goods, despite the fact that exports of goods increased by 17.6% yoy. But it was not enough to compensate an increase in mineral/energy imports of 21% yoy. Since net financial inflows amounted to USD 1,634 million, they covered the current account deficit and allowed international reserves to increase to USD 18.6 billion by the end of September 2017 (3.7 month of the future imports.)
Main Macroeconomic Indicators |
2011 |
2012 |
2013 |
2014 |
2015 |
2016 |
2017f |
|
GDP, USD billion |
163 |
173 |
180 |
130 |
87 |
93.4 |
101.0 |
|
Real GDP Growth, % yoy |
5.5 |
0.2 |
0.0 |
-6.6 |
-9.9 |
2.3 |
2.2 |
|
Fiscal Balance (incl. Naftogaz/Pension Fund),% of GDP |
-4.3 |
-5.5 |
-6.5 |
-11.7 |
-2.1 |
-2.3 |
-3.5 |
|
Public Debt, External and Domestic, % of GDP |
36.4 |
36.6 |
40.4 |
69.4 |
79.1 |
81.2 |
78.0 |
|
Consumer Inflation, eop, % yoy |
4.6 |
-0.2 |
0.5 |
24.9 |
43.3 |
12.4 |
12.5 |
|
Hryvnia Exchange Rate per USD, eop |
8.0 |
8.1 |
8.2 |
15.8 |
24.0 |
27.0 |
27.0 |
|
Current Account Balance, % of GDP |
-6.3 |
-8.3 |
-9.0 |
-4.1 |
-0.2 |
-4.1 |
-3.5 |
|
FDI, Net Annual Inflow, USD billion |
7.0 |
7.2 |
4.1 |
0.3 |
2.3 |
3.4 |
3.0 |
|
International Reserves, USD billion |
31.8 |
24.5 |
20.4 |
7.5 |
13.3 |
15.5 |
18.0 |
|
Public External Debt, USD billion |
33.3 |
32.1 |
31.7 |
34.9 |
42.6 |
42.5 |
47.0 |
|
Private External Debt, USD billion |
92.7 |
102.3 |
110.3 |
91.2 |
76.0 |
69.9 |
65.0 |
Political and Reform Developments
For over three years, Ukraine has suffered from military actions in its Eastern border. Russian-backed rebels have continue their frequent fire against Ukrainian forces, which have responded in kind. All these attacks are recorded by the members of the OSCE monitoring mission in the region. A positive development for Ukraine has been the reactivation of talks about a UN peace-support mission that may be established in the temporary-occupied territories of Donbass. The situation in the region might be significantly improved as soon as the UN peacekeeping mission is introduced. The UN Security Council should take its decision on this matter in the course of 2017.
Despite the military actions in the Eastern part of Ukraine, the Ukrainian authorities continue to deliver results in reforming the country. During the month measures were undertaken to improve the investment climate in the country. In particular, there were some important developments in the field of (i) fighting corruption and (ii) simplification of doing business in the country. Fighting corruption has become the main item in Ukraine’s reform agenda. In particular, Ukraine is expected to submit legislation to establish anticorruption courts within the next few weeks. Along with the privatization law, which has passed first hearing in Verhovna Rada in November, these measures may significantly improve the country’s business climate. In addition, the Government submitted to Verhovna Rada a draft law on Business Pressure Relief. In November, Ukraine improved its position in Doing Business Report of the World Bank. The country’s rank increased by 4 knots to 76 out of 189 nations.
Ukraine has continued cooperation with the IMF, although the Fund once again postponed its tranche release within the EFF Program. The Fund decided to suspend negotiations to analyze the data on the recently approved pension reform. The next tranche is expected to be USD 1.9 billion equivalent. For the next provision, the IMF requires Ukraine to adopt a fiscal budget for 2018 with a deficit of no more than 2.5% of GDP, pass the new law on privatization, establish anti-corruption courts, and set economically sound gas prices.
Economic Growth
According to preliminary information of the State Statistic Service of Ukraine, economic growth in the 3rd quarter of 2017 reached 2.1% yoy, a rate higher than the 1.7% yoy previously anticipated. This growth was fueled by domestic demand (investment activity and household consumption), stimulated by a 19% yoy increase in real wages in January-September 2017. On the production side of GDP, the real sector posted an uneven performance in the 3rd quarter with production growth of basic industries close to zero in July and September but with a good growth rate of 4.4% yoy in August.
GDP is expected to growth by 2.2% in 2017 and 3.5% in 2018.
In September 2017, agricultural output declined by 3.0% yoy principally due to bad weather. Industrial production also declined but only by 0.3% yoy. On the other hand, construction output increased by 10.2% yoy, retail trade by 8.2% yoy, cargo freight by 5.3% yoy, and passenger’s turnovers by 5.2% yoy.
In September, the industrial branches that showed the highest rates of growth were the following: manufacturing of chemical products (33.4% yoy), manufacturing of motor vehicles (22.8% yoy), furniture production (8.6% yoy), textile production (by 8.5% yoy), pharmaceutical products (4.4% yoy), rubber and plastic products (4.1% yoy), and metallurgical production and basic metal products (by 2.2% yoy). On the other hand, the largest manufacturing production drops, took place in the manufacturing of refined products (-17.2% yoy), supply of electricity, gas, steam and air conditioning (-3.4% yoy), food products and drinks (-2.2% yoy), wood products, paper production and printing activities (-2.0% yoy), and machinery and equipment other than motor vehicles.
With regard to the geographical distribution of industrial production, the largest output increases in September took place in Ivano-Frankivsk region (with 26% yoy growth), Rivne (with 21.9%yoy), Chernivtsi (16.1%yoy), Odesa (11.8%yoy), Lviv (6.3%yoy), Dnipropetrovsk (5.9%yoy), Kharkiv (5.9%yoy), Vinnytsya (5.2%yoy), Kyiv (4.5%yoy), Poltava (3.9%yoy), Kherson (1.8%yoy), Zakarpattya (1.1%yoy) and Zaporizhzhya (0.3%yoy). On the other side, the highest declines in production occurred in Luhansk region (-37%yoy), Sumy (-15.8%yoy), Kyiv city (-12.1%yoy), Donetsk (-10.9% yoy), Kirovohrad (-8.4%yoy), Chernihiv (-6.3%yoy), Ternopil (-5.9%yoy), Khmelnytskiy (-4.8%yoy), Volyn (-4.4%yoy), Mikolayiv (-2.1%yoy), Cherkasy(-1.6%yoy), and Zhytomyr (-0.7%yoy).
Fiscal Policy
Expected monthly increase in state budget expenditures and monthly decline in state revenues led to a fiscal deficit of UAH 23.5 billion in the state budget in September. Taking into account the unexpected deficit in local budgets of UAH 3.5 billion, the cumulative nine-month fiscal budget balance remained positive but significantly declined to UAH 41.7 billion (or about 2.1% of period GDP).
The year-over-year growth of state budget revenues significantly decelerated in September. It dropped 8 percentage points to 25.4% yoy despite accelerated growth in tax revenues of 34.6% yoy. Tax revenues increased thanks to reciepts of VAT associated with reactivated internal demand. Also, depreciation of hryvnia and expanded imports led to increased receipts from excise taxes on impored goods and taxes on international trade. The reason for the overall deceleration in the growth of total state budget revenues was a decline in nontax revenues due to lower own-revenues of budgetary institutions. Growth of the cumulative consolidated budget revenues decelerated again reaching 43.7% yoy in January-September 2017.
Despite a significant monthly increase, state budget expenditures recorded deceleration in growth in September. A 7.7 percentage point drop in growth rate to 21.3% yoy was the result of decelerated increase in current transfers and declines in social security and capital expenditures which more than offset fast growth in payroll expenditures and expenditures on goods and services. Expendituers on state debt servicing saw little changes, despite interest payments on external debt. Growth of the cumulative consolidated budget expenditures remained unchanged at 21.3% yoy in January-September.
Monetary Policy
Inflation. Consumer inflation remained virtually unchanged in September. The all-items index remained at 16.4% yoy. The core inflation also remained almost flat at 7.7% yoy.
Most of the major groups of goods and services saw little changes in prices in September. Nevertheless, significant growth of prices was reported for foodstuffs, restaurants and hotels, and education. In particular, growth of foodstuffs prices accelerated by 2.0 percentage points to 18.8% yoy on the back of further acceleration in growth of wholefoods prices (mainly because of increased prices of eggs, meat, dairy products, fruits, and vegetables). Significant deceleration in prices was registered for wearing apparel and footwear and for housing and utilities. Decelerated growth in housing and utilities tariffs was the result of statistical base effect (electricity tariffs were increased in September 2016).
Taking into account continued upwards trend in wholefoods prices and increase in pensions under the pension reform, we have to further revise our inflation forecast upwards to 12.5% yoy for 2017.
Banking Sector. National currency deposits expanded again in September at a rate similar to August’s rate. Acceleration of growth of the corporate deposits to 8.9% yoy almost fully offset the deceleration in growth of the household deposits to 13.5% yoy. Thus, total national currency deposits grew by 12.4% yoy. Further acceleration in growth of corporate foreign currency deposits denominated in USD to 7.1% yoy was the reason of faster growth in total foreign currency deposits to 6.1% yoy, as there were no changes in dynamics of household deposits (which declined by 3.1% yoy).
Similarly to bank deposits, in September national currency loans expanded at almost the same rate as in August. Some deceleration of growth of corporate loans to 20.0% yoy was more than compensated for by acceleration in growth of household loans to 19.6% yoy. Thus, total national currency loans expanded by 19.0% yoy. As for the foreign currency loans denominated in USD, changes in dynamics of both corporate and household loans were minimum. Therefore, the decline in total foreign currency loans denominated in USD remained almost unchanged at 21.2% yoy.
Decline in bank cash resources and in balances at the correspondent accounts of banks led to a monthly decline of the monetary base of 1.5% and further deceleration of its year-over-year growth to 5.1%. At the same time, increased balances at deposit accounts denominated in hryvnia caused a monthly increase in money supply of 1.8%. Furthermore, the year-over-year growth of money supply accelerated to 6.6% in September.
Hryvnia Exchange Rate. During October, the UAH/USD exchange rate saw several trend reversals. Repatriation of dividends was the main cause of the exchange rate depreciation during the first several trading sessions of the month. Then, the exchange rate appreciated again, when banks with foreign capital decreased their dollar purchases. Thereafter, VAT reimbursements became the major factor influencing exchange rate dynamics. The first VAT reimbursement tranche led to a short-term depreciation in the middle of the month. The second VAT reimbursement tranche was accompanied by negative news in relation to cooperation with the IMF (the Fund decided to provide the next tranche within the EFF program not earlier than 2018). Therefore, the exchange rate was on the depreciatory trend by the end of the month. As a result, the UAH/USD exchange rate depreciated by 1.35% during the month reaching 26.87 UAH per USD.
International Trade and Capital
In September 2017, Ukraine’s current account deficit of the balance of payments increased by 5.8% yoy to USD 998 million, compared to a deficit of USD 943 million in September 2016. The main reason for the expanded CA deficit was an increase in the deficit in the trade of goods, which increased from USD 657 million in September 2016 to $891 million in September 2017. The balances in primary and secondary income remained relatively stable. The increase in the deficit in the trade in goods account took place despite the fact that exports of goods increased by 17.6% during the previous 12 months, reaching USD 3,412 million in September 2017. But imports of goods increased by a larger percentage of 21% yoy to USD 4,303 million.
 In September 2017, the highest growth rates yoy in export commodity group took place in mineral products (85.2% yoy to USD 335 million), followed by chemicals (32.2% yoy, USD 187 million), agricultural products (22.5% yoy to USD 1.6 billion), industrial goods (19% yoy, to USD 56 million), timber & wood products (13.8% yoy, to USD155 million), ferrous and nonferrous metals (7.6% yoy, to USD 796 million). At the same time, machinery and equipment, and informal trade fell down by 13.4% yoy (to USD 231 million) and 24.2% yoy (to USD 76 million), respectively.
On the import side, the largest import expansion took place in mineral (mainly energy) products (40.1% yoy, to USD 1.1 billion), ferrous and nonferrous metals (37.4% yoy, to USD 274 million), machinery and equipment (30.4% yoy, to USD 1.2 billion), agricultural products (23.8% yoy, to USD 353 million), chemicals (16.3% yoy, to USD 796 million), and industrial goods (5.8% yoy, to USD 199 million).
Ukrainian regional distribution of exports showed an increase in the share of Europe from 33.1% of the total in January-September 2016 to 36.1% in 2017, thanks principally to the FTA with Europe. On the other hand, the share of Asia was reduced from 34.9% in the first nine months of 2016 to 32.2% in 2017. The share of Russia in Ukrainian exports declined slightly from 9.0% in 2016 to 8.7% in 2017.
On the import side, the main supplier of Ukraine continues to be Europe, which increased its share in Ukrainian imports from 39.2% in Jan-September 2016 to 41.3% in 2017. Russia also was able to raise its share in Ukrainian imports from 12.5% in 2016 to 13.8% in 2017. As a consequence, the trade imbalance with Russia raised by 63.4% yoy to USD 2.3 billion in Jan-September 2017, compared to USD 1.4 billion in 2016. The share of Asia remained at 20.1% (USD 7 billion) on Ukrainian imports of goods.
The current account deficit of USD 998 million in September 2017 was fully covered by financial inflows of USD 1,634 million coming in that month. These financial inflows were originated principally by the issuance of government Eurobonds and other government foreign debt amounting to USD 1,403 million. In addition, foreign direct investments into Ukraine amounted to USD 180 million in September 2017. As the consequence, Ukraine consolidated Balance of Payments improved by USD $ 637 million in September, leading to growth of international reserves to USD 18.6 billion (or the equivalent to 3.7 months of imports).